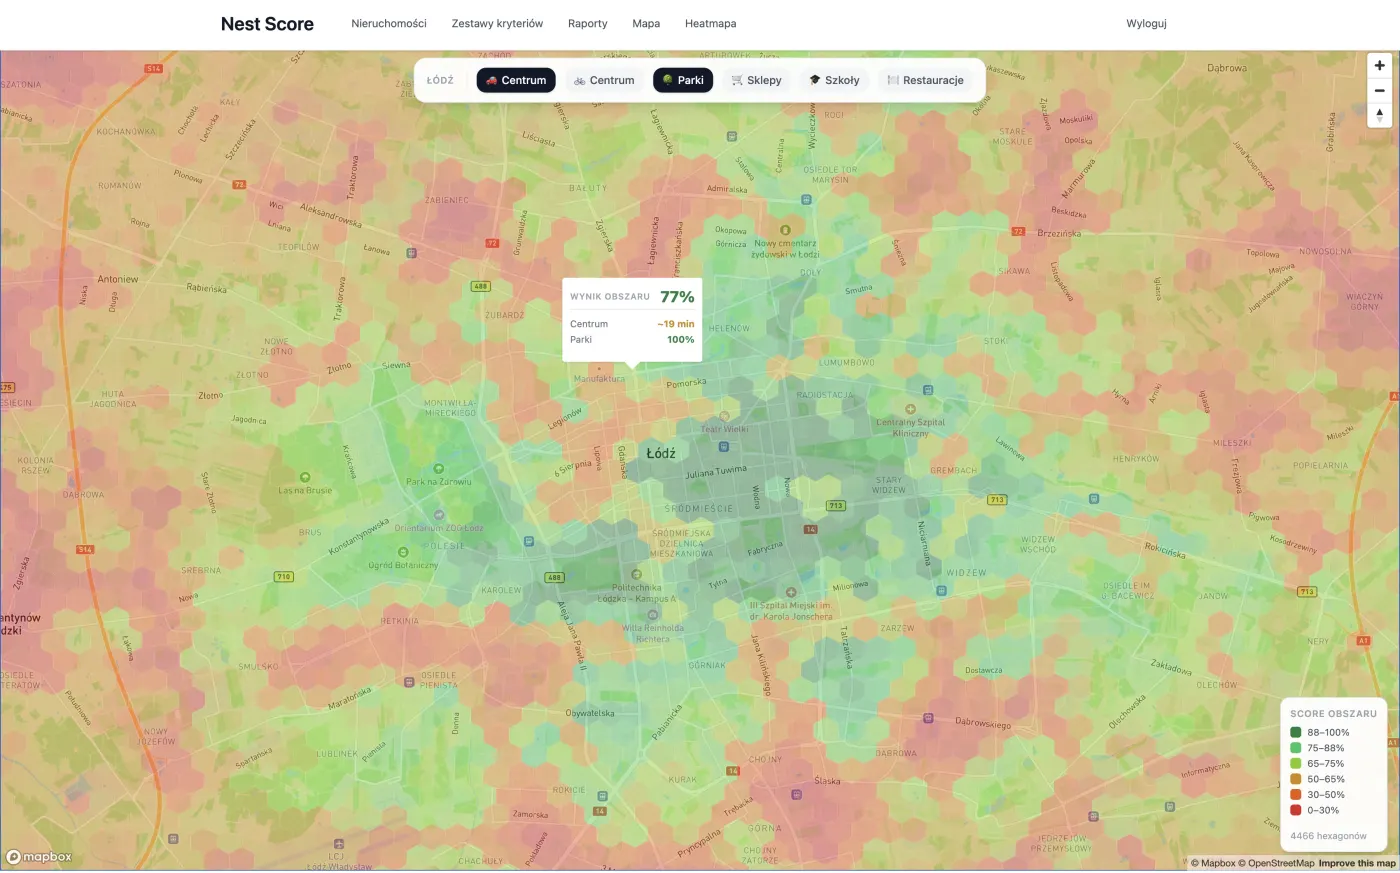
What the city heatmap is
The city heatmap shows which areas in Gdynia fit your chosen criteria better: commutes, services, greenery or noise.
What is worth comparing in Gdynia
On the map it is worth checking not only the tight centre but also areas such as Orłowo, Redłowo, Śródmieście, Działki Leśne, Witomino, Chwarzno-Wiczlino, Karwiny, Dąbrowa, Obłuże and Pogórze. A good location depends on your routes, not on a single opinion about a district.
How the criteria work
The criteria should reflect your real needs: work or university, school, transport, everyday shopping, recreation and an acceptable price trade-off.
Why different people may have a different best location
There is no single best district for everyone. A location that is good for remote work, a family with a child or a daily transit commute can mean completely different addresses.
A flat closer to the SKM and services can work completely differently from a similar offer further from the centre, even if the price per square metre looks the same.
How to check a specific address
Once you find an area on the map, it is worth adding a specific property to mScanner and generating an address report. Only then do you see the price, surroundings and risks in one place.
How to compare several flats
The city heatmap works best as part of a comparison: you save several flats, check the reports and line up their results side by side.
Frequently asked questions
Does the city heatmap show a ranking of districts in Gdynia?
It is not a universal ranking. The result depends on your criteria, so different people can get a different best location.
Does the city heatmap work without adding a flat?
You can start from the map, but the best result comes from adding a specific address and comparing it with other saved flats.
Does the match result replace a price analysis?
No. It is worth setting the location result against asking prices, transaction prices and the address report.
Which district in Gdynia is for me?
That answer cannot be reduced to a single ranking — it depends on your routes, budget and what you value. The city heatmap works like a calculator: you set the criteria (commute, price, greenery, noise, services) and the tool scores the city areas and shows where the fit is best for you.
Is the city heatmap the same as a price heatmap?
No. It is not a map of a single variable (such as price alone). The city heatmap scores city areas by combining prices, travel times and nearby points — greenery, shops, schools — into one result matched to your criteria.
Does the city heatmap work without signing in and for free?
Yes. You can open the city heatmap without creating an account — set your criteria and see the area match straight away.